From messy Annex A to impactful child journeys
By Celine Gross, associate at Social Finance. Part of a series published by the Rees Centre on data (see below for related posts).
As a data scientist focusing on Children’s Services, I’ll admit that the first things which spring to mind when you mention Annex A and CIN Census are “inconsistent” and “designed for compliance”. That said, these datasets hold a wealth of information and my team found a powerful way to use them to provide evidence of the quality of children’s journeys through social care. It may also be useful for you.
For those who don’t know them, Annex A and CIN Census are children’s services datasets created by local authorities. Annex A is a document prepared for Ofsted inspections of children’s services departments, listing all events that happened in the last six months (contacts, referrals, child protection plans, etc.) and some information on children looked after (care leavers, adopters, etc.). CIN Census are submitted by local authority children’s services annually to the Department for Education and only contain details of children ‘in need’ (being assessed or under a child plan) from the past fiscal year.
What Works for Children’s Social Care provided a grant to the team at Social Finance to facilitate this work. We were also in receipt of grant funding from the Christie Foundation. Both streams of funding allowed us to explore the use of data and how it could be used to identify promising practice. Although the project had some unintended outcomes, we were able to create and share tools such as template Data Processing Agreements which can help other partnerships between Local Authorities (LAs) or between LAs and partners to work together safely and ethically on analysing individual-level data.
From ‘events’ to ‘journeys’
We took the lists of events from Annex A and CIN Census and turned them into ‘child journeys’– strings of events concerning the same individual. We did it using Python but you could do the same with R and other programming languages. This allows us to make journeys themselves the objects of analysis, or to analyse events based on what happens before or after them.
A simple journey, simply expressed looks like this:
![]()
With a bit of visualisation, a more complex journey looks like this, over an 18-month timeframe:
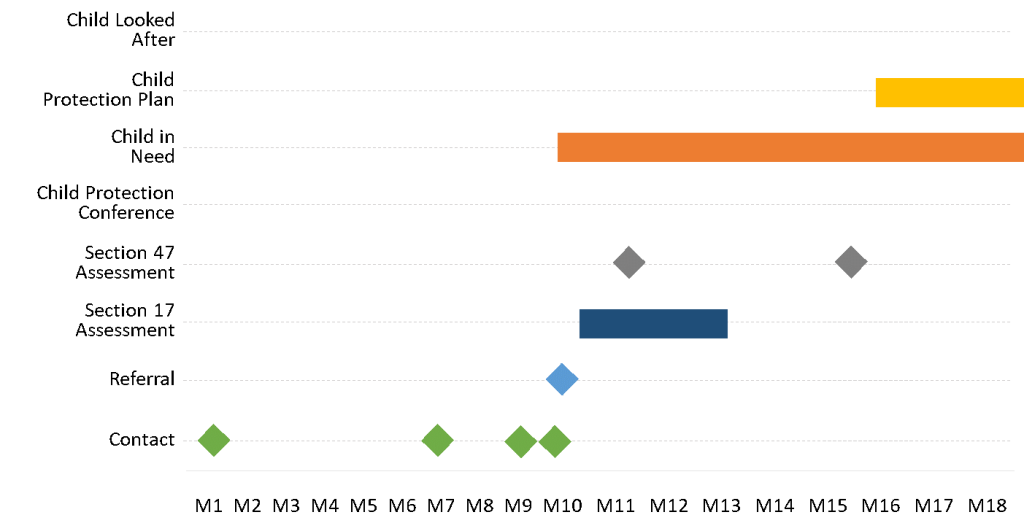
So what?
We found that analysing journeys opened new possibilities for looking at the quality of processes of a system, rather than at their compliance.
Often, this starts with a practice insight: ‘X shouldn’t generally happen after Y’ – allowing us to define an archetypal journey which our local authority partners are interested in, and see how often it is happening, and in what contexts.
One example was when we focussed on ‘potentially missed risk at assessment’ – a journey where a child’s first assessment did not result in a plan (higher-level intervention) but a subsequent referral within 6 months did.
Some numbers jumped out for social care service managers and quality assurance directors:
· In some local authorities, these ‘potentially missed risk’ journeys were happening 25% more often with some demographic groups than others, and more often with certain types of risk – identifying opportunities for quality audit and the types of cases first-line managers should review;
· In some local authorities, they happened more often at the weekends and at busy times of year – putting some numbers on things managers had long suspected to be true.
Many of these patterns were present in some local authorities but not others, highlighting possibilities for sharing of good practice.
Can you use journeys in your work?
These are just a few examples of what journey analysis can do. There are many more interesting journey archetypes and use cases that could turn this journey analysis into better decisions, targeted service improvement work and interesting research. We’re hoping to partner with universities and with local authorities to take this forward.
We’re keen to share what we learnt. We have started publishing our journey code on GitHub. We’re excited to see how it could be improved and how it could be used in local authorities (with around 600 analysts across England), by researchers and by others. We’ve already benefitted massively from being able to check our interpretations of how the data represents reality with analysts and managers in four local authorities, and we hope that GitHub can become a place to grow that collaboration.
Please feel free to add your own tools as well as to improve the ones we have started. You might also be interested in the code that cleans Annex A according to the Ofsted guidance here.
What Works for Children’s Social Care will soon share a report detailing aspirations for the project, what we learned and what we see as possible and useful in this type of work. Please visit their website for details.
There is a growing community of data-minded people, passionate about supporting better decision-making in the children’s services space. Let’s continue collaborating and building on each other’s learning: if you see the potential of child journeys, please get in touch! And do share your ideas: what tools did you create?
This blog post was written by Celine Gross from the consultancy Social Finance.
Contact Celine: celine.gross@socialfinance.org.uk
It is part of a series of posts published by the Rees Centre on data. The Rees Centre welcomes guest blog posts from professionals across the sector. Views expressed are authors’ own and do not represent those of the Centre.
Related Rees Centre blog posts:
Using data tools in local authority children’s services
Exploring complexities of children’s social care data
Related network:
Children’s Social Care Data User Group
The Children’s Social Care Data User Group (CSC DUG) was set up in 2017 by the Rees Centre, University of Oxford and Thomas Coram Research Unit, UCL. It is a network of academics, local authority data managers, analysts, charities and funders with a shared vision that administrative data from children’s social care and other relevant agencies in England can be analysed and fed back into policy and practice to improve the way that children’s social care services respond to children, young people and their families.
The group focuses on data submitted to and analysed by the Department for Education (namely the SSDA 903 children looked after data and the Children in Need Census data).
Membership is open to any individual or organisation who is using, or plans to use, children’s social care data collated by the Department for Education (Child in Need data, Looked After Children data or Section 251 social care expenditure data in relation to children’s services).
To join the group’s mailing list: email rees.centre@education.ox.ac.uk
